Over the past three years, there is 1 or more years with 0 condo sales in Kalakauan, which makes making a graph not very relevant. The graph above, therefore, represents all Waikiki condos, which provides a larger dataset and greater statistical significance for drawing meaningful conclusions.
Waikiki Market Summary (January '25 - December '25 vs January '24 - December '24)
Median Sales Price: $514,908 vs $530,000 — down 2.85%
Number of Sales: 744 vs 804 — down 7.46%
List-to-Sale Price Ratio: 97.15% vs 97.25% — down 0.10%
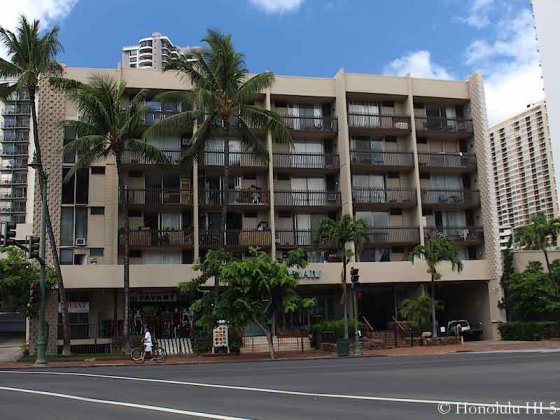
Waikiki has unique short-term rental rules. We are local real estate agents who know the local market and its regulations very well. Contact us when you are considering purchasing to get the best advice possible.
Listings appear instantly - new properties added within one minute.
We need your email address, if you would like email alerts. Please Create Account - takes 1 min - or Sign In .
We exclude Leasehold data from this market analysis because Leasehold properties do not compare with regular Fee Simple properties.
We use median instead of the average because it depicts more accurately a central tendency to the sample size. Example: Take 5 numbers - 3, 5, 7, 9, 21. The median is 7 (the middle number) and the average is 9 (sum of all divided by 5).
We count days on market from listing date through closing date.