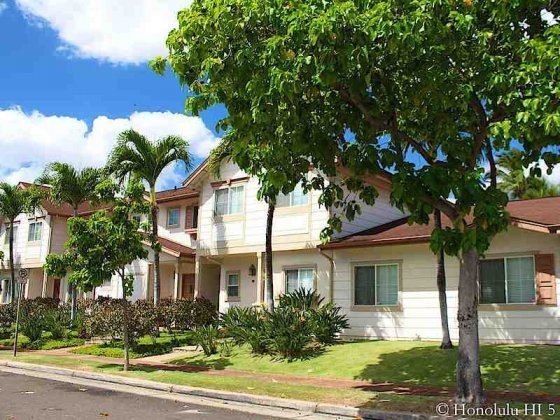
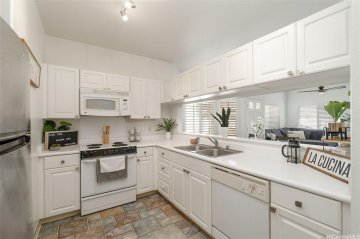
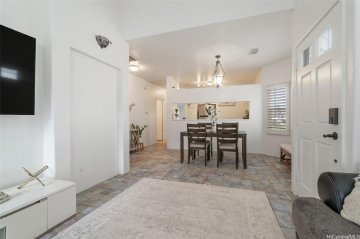
About Ke Aina Kai The Ke Aina Kai townhouses are difficult to sum up. These Ocean Pointe residences in Ewa are the products of different building phases, with varying layouts in each. In total, 76 separate buildings comprise this slice of the community, bringing an affordable, but quality home option that has proven to be popular.
There are some quite small units, but that's only 9 of these 256 Ewa townhomes. The vast majority start with 2BRs of 920 sq ft on up to 1,008. The 3BRs start with 941 sq ft, rising to as much as 1,821 of indoor space!
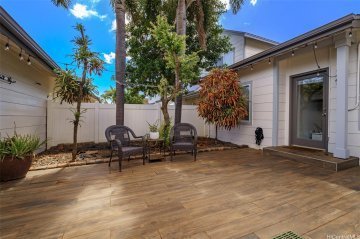
You also have a nice little yard, both on the front and back, a feature that's hard to come by in many other parts of Oahu. The chances are very good you'll have a palm tree or two just outside your door as well. These tree-lined boulevards are picture perfect for walking in the cooler evening time.
From your home it's an easy drive to the beach just to the south or a ride west to Kapolei, where new shopping and eating choices seem to arrive every week.
Though they took a while to complete these residences, once here, you'll agree that they got it right.
Over the past 3 years, an average of 21 fee simple condos sold per year in Ke Aina Kai. This moderate sample size provides a reasonable view of market trends, but some variability may exist.
The Ke Aina Kai graphs use median data points instead of averages, as the median is less affected by extreme outliers and better reflects typical trends.
Ke Aina Kai Market Summary (February '25 - January '26 vs February '24 - January '25)
Median Sales Price: $632,000 vs $675,000 — down 6.37%
Number of Sales: 20 vs 13 — up 53.85%
List-to-Sale Price Ratio: 99.14% vs 99.41% — down 0.27%
Listings appear instantly - new properties added within one minute.
We need your email address, if you would like email alerts. Please Create Account - takes 1 min - or Sign In .
We exclude Leasehold data from this market analysis because Leasehold properties do not compare with regular Fee Simple properties.
We use median instead of the average because it depicts more accurately a central tendency to the sample size. Example: Take 5 numbers - 3, 5, 7, 9, 21. The median is 7 (the middle number) and the average is 9 (sum of all divided by 5).
We count days on market from listing date through closing date.