— Hawaii real estate is expensive. It always has been, and always will be compared to many other US locations. The four primary reasons are:
- High demand for ‘paradise.’
- The scarcity of buildable land, – This is an island state.
- High shipping costs, – No other major population center in the world is this remote, surrounded by more ocean than Honolulu.
- Lack of incentives for developers to build. – Governmental red tape and thin profit margins due to expensive land and development cost prevent developers from offering truly affordable housing solutions. Some developers migrate to other easier, more lucrative mainland markets to develop.
Every day I meet buyers that are experiencing sticker shock and anxiety about when is the best time to enter the market. Many buyers seem to argue: “Real estate values have increased too quick too soon. Prices here are so expensive, they have to come down.”
This mindset implies that there might be a better time to buy in the future. Fear of a possible market collapse is holding back nervous buyers from taking the leap. After all, wasn’t there such a collapse about 10 years ago? It sure is bound to happen again, is it? Real soon, right?
By July 2019 the current economic expansion will become the longest in US history. If the 10-year anniversary of the financial crisis and the extended expansion does not mean the ‘end is near’ than what else could possibly hold up real estate values and prevent a seemingly overdue correction?
But, what if some of these assumptions are wrong? Is it possible that the end is not near and Oahu’s real estate market has nothing to correct from? What evidence if any suggests a bubble? Is there excess or irrational exuberance?
Here we look at a few of the metrics that define values and clarify affordability in historical terms. Instead of being blinded by a ‘wishful thinking confirmation bias,’ we will look at the data to better understand Hawaii’s real estate dynamics.
Just because the market feels pricey does not mean a decline in the short-term is imminent. Oahu’s supply is limited, and demand remains robust.
At this time we have a steadily strengthening economy in the US and around the world with minimal inflation risk and no imminent recession threat. These are conditions for Hawaii real estate values to remain strong and potentially continue to move higher.
What Makes A Healthy Real Estate Market?
A healthy real estate market is defined by stable supply and demand. In addition, the supply should be relatively ‘affordable’ for the local population. Otherwise only outsiders would be able to buy. In a healthy market, a substantial portion of the local population should be able to afford a home. However, in real life, and in all markets, there will be some that regretfully cannot afford to buy real estate.
Willingness is not enough. Buying a home also requires ‘ability.’ Means you need money, and or the income to qualify for a mortgage loan. But how affordable is buying a home?
“Affordability” is defined by three factors:
A) income, B) interest rates, and C) home prices.
Affordability for the local buyer in their respective local market is defined by the ratio of the mortgage payment to the median income at today’s median home price. The lower the ratio, the more affordable the market.
Let’s check how each of these factors historically performed to understand how affordability compares today.
1.) Real Median Household Income
A recent article by the First American Exchange Company analyzes the US historical ‘Renter House-Buying Power.’ Renter House-Buying Power means the ability for a 1st time home buyer to buy. If you already own a home with built-in equity, your buying ability might be more favorable. That is if you sell before you buy.
Renter house-buying power (RHBP) is defined by the percent of current homes for sale that the median renter can afford to buy. The higher the percentage of homes the median renter can buy, the more affordable is the market.
In 2000 the median US renter had an income of $40,750, and $163,232 of house-buying power, affording 57% of the homes that sold in 2000.
In 2006, due to steep price increases, the median US renter could only afford 37% of homes sold that year.
In 2012, due to increasing wages and softer real estate prices, the median US renter could afford 68% of homes sold that year. This was the year of peak RHBP in the US.
In 2017, the median renter could afford 64% of homes sold that year. A level only exceeded by 2012.
In fact, rising wages have kept pace with price increases keeping affordability in the US at the same level since 2015.
The following graph shows the real median US household income from 1984 to 2016:
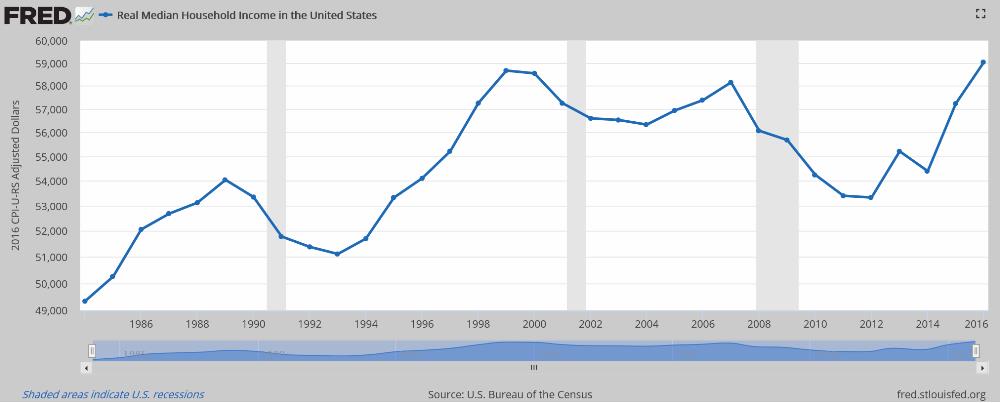
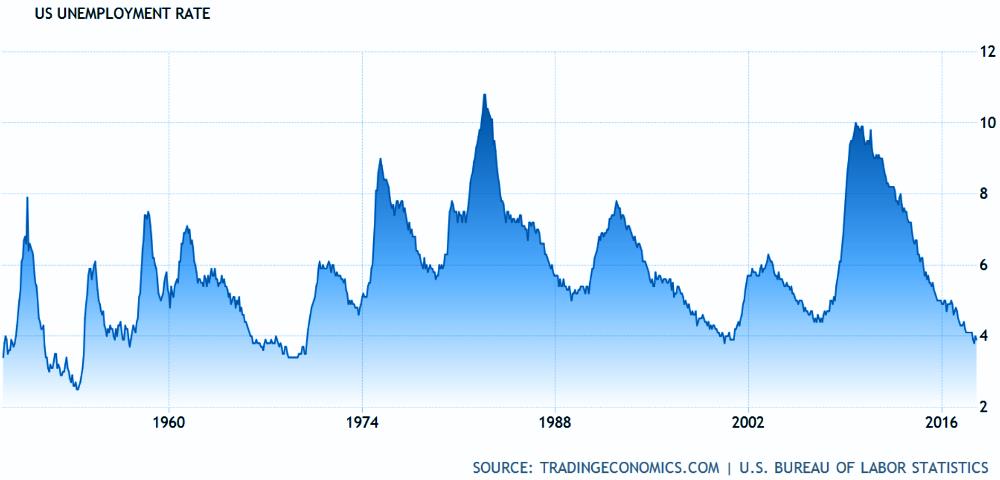
I understand that not everyone enjoyed their proportionate increase in income. That is unfortunate for the individual. Consider that there has never been a better time to upgrade your job than today! The US unemployment rate hit a record low of 3.9% in July 2018.
Just a few years ago, an unemployment rate of 5% was considered full employment (one of the Fed’s dual mandate) and believed to be inflationary. Today the US enjoys a record low unemployment rate with a stubbornly low <2.5% inflation rate.
Honolulu’s unemployment rate dropped to 2%, a record low for the last 50 years!
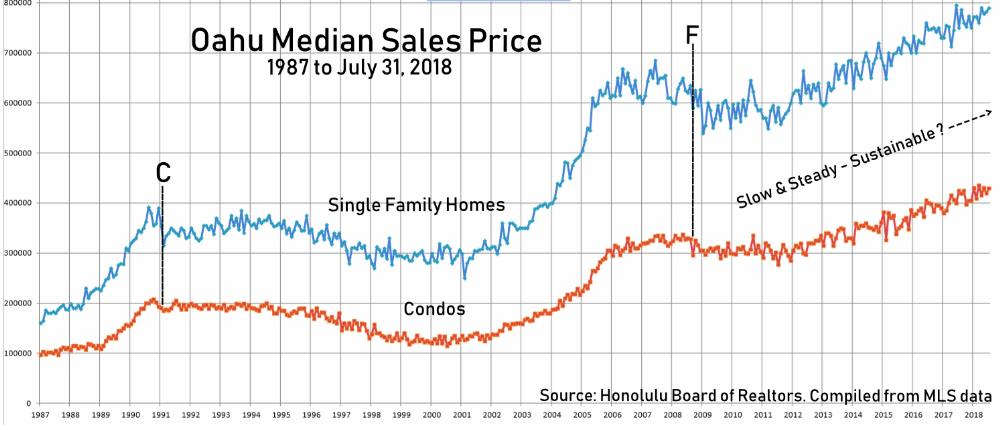
2.) Median Home Sales Prices
Because of the financial crisis and the subsequent great recession, the most recent price correction resulted in Oahu’s median sales price dropping by 10%. That’s all.
You might call this a bust, or a consolidation. Markets tend to be cyclical based on economic expansion and recession. Real estate market values can overshoot in either direction before finding their new balance as defined by supply and demand.
The long-term trend has been upward. If you draw a straight line from the left 1987 starting point of the blue or red graph to the right 2018 endpoint of the respective blue or red graph, you will notice the graph over-, or under-shooting compared to the straight line. This over- or under-shooting can continue for some time until median prices will adjust towards the long-term straight trend line. This is called a ‘regression to the mean.’
Oahu’s median sales price has been on a steady sustainable ~4% incline with little fluctuations since 2009. Oahu’s long-term appreciation trend has been ~4.6 % since 1987. — The current steady ~4% appreciation is the ‘mean’.
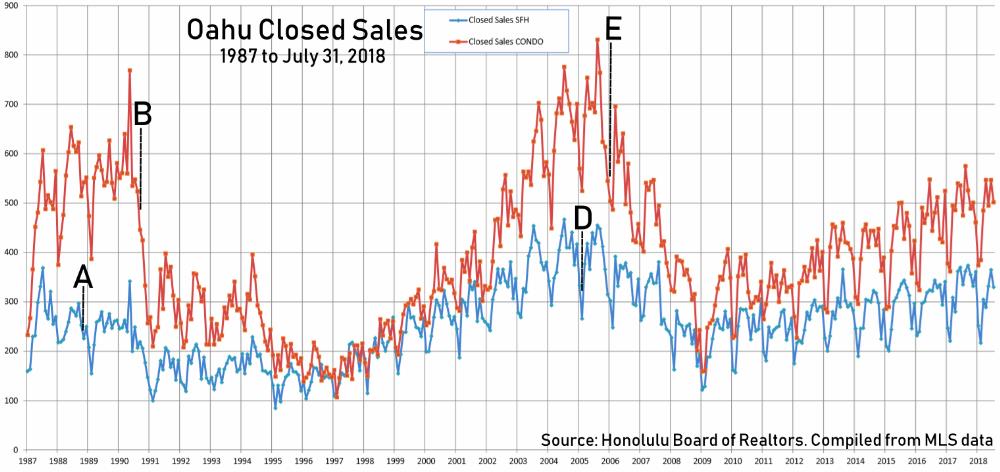
Oahu’s Closed Sales historical graph shows some seasonality. There are more closed sales during the summer and fewer during the winter. Typically, more sellers are listing their homes for sale during the summer, and more buyers are looking to buy during that time. But the seasonal swings in closed sales activity show no impact on median sales prices.
However, take a close look at the long-term trend of Closed Sales. Compare both graphs and you will notice that the ‘Closed Sales’ momentum changes before the ‘Median Sales Price’ momentum changes.
During the last two cycle peaks, Closed Sales activity first slowed for Single Family Homes in 1988 (A), then for Condos in the 2nd half of 1990 (B), and then the Median Sales Price softened in 1991 (C). The same sequence repeated itself during the next cycle peak when Closed Sales activity first slowed for Single Family Homes in 2005 (D), then for Condos in 2006 (E), and then the Median Sales Price softened in 2008 (F). – This is not rocket science.
Look for a slowdown in the ‘Closed Sales’ trend before expecting to see a slowdown in price movement. It will evidence itself in lower lows during the winter and lower highs during the summer in Closed Sales, first for Single Family Homes. When you notice a similar slowdown in Closed Sales for Condos, then you have the preconditions for a potential trend change in median sales prices.
So far, sales activity remains robust on a slow and steady climb since 2009. At this time there appears to be no imminent softening of Oahu’s median sales prices.
3.) 30-Year Mortgage Rates
There is a popular myth circulating: “Since interest rates will be moving up, prices will need to come down.” This popular pseudo-explanation has been around since the Summer of 2003 when 30-year fixed rates dropped for the first time below 5.5%.
However, there is no measurable inverse correlation between mortgage rates and Oahu real estate values.
Instead, we have observed that during times when interest rates rise, buyers tend to select more affordable adjustable-rate mortgages instead of the fixed rate option. In other words, instead of postponing their purchase, buyers simply selected lower rates, albeit riskier adjustable loans with the expectation to refinance when 30-year fixed rates become favorable again. Sometimes borrowers would buy down their interest rate by electing to pay higher up-front points. We have also seen sellers and developers offer closing cost credits to be applied towards buyer’s up-front points to buy down the mortgage interest rate. When rates are high, buyers and sellers get creative.
The graph below shows the average US 30-year fixed mortgage rate from 1987 through 2017:
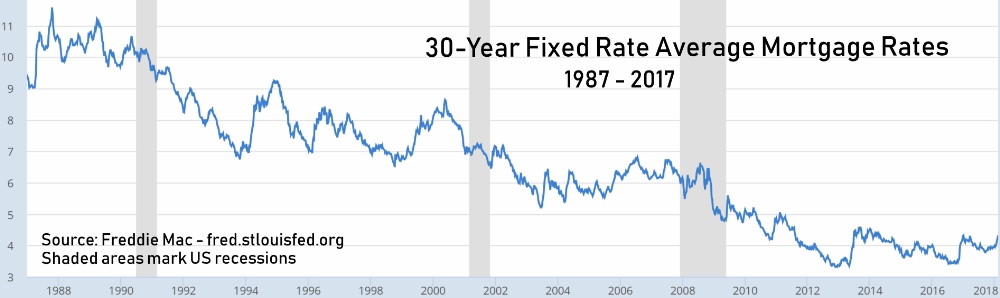
Notable times of steep interest rate increases have been:
• Between 3/27/1987 and 10/16/1987, from 9.03% to 11.58%.
• Between 10/22/1993 and 11/25/1994, from 6.74% to 9.25%.
• Between 2/16/1996 and 7/12/1996, from 6.94% to 8.42%.
• Between 10/9/1998 and 5/19/2000, from 6.49% to 8.64%.
• Between 6/20/2003 and 7/20/2006, from 5.21% to 6.80%.
• Between 11/21/2012 and 8/22/2013, from 3.31% to 4.58%.
• Between 7/7/2016 and 12/29/2016, from 3.41% to 4.32%.
Compare the above mortgage interest rate graph with the Median Sales Price graph. There is no downturn in the median sales price during these periods of interest rate increases.
4.) The Real Measure Of Oahu’s Affordability
As mentioned before: Affordability for the local buyer in their respective local market is defined by the ratio of the mortgage payment to the median income at today’s median home price. The lower the ratio, the more affordable the market.
The following graph shows Oahu’s historical ratio of the average 30- year Mortgage Payment to Oahu’s Median Household Income at Oahu’s Median Home Price:
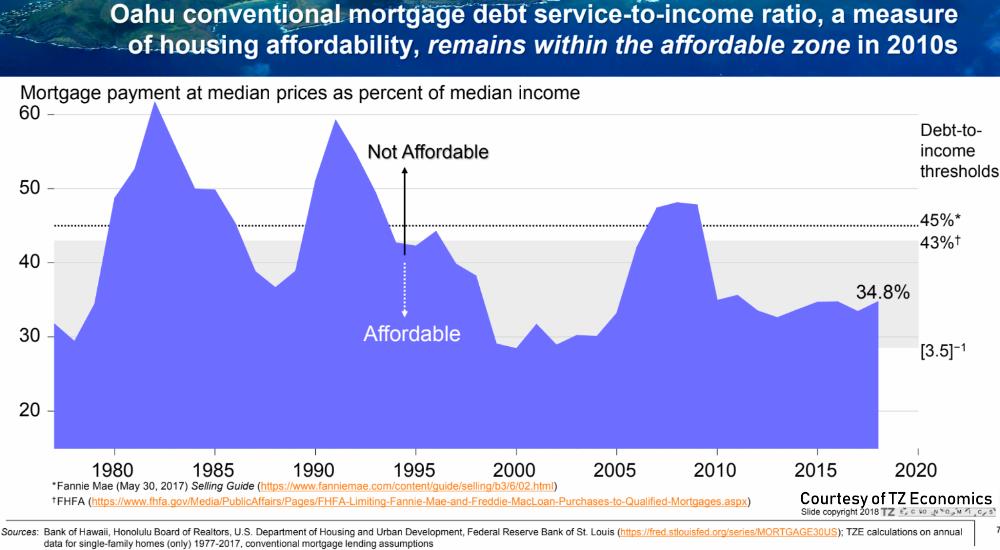
Since 1976 there have been only two time periods where Oahu’s affordability has been more favorable than today: 1976-1977 and 1998-2004. In fact, Oahu’s affordability today is a lot closer to the lower end of the range and nowhere close to its historical top range.
Since 2009 affordability for Oahu’s median household income remains stable. Yet, many perceive the market as overextended!?
I understand that Oahu’s real estate market feels expensive. It always has. It was never easy to buy in Hawaii. You might have to come to terms, this might not change.
We recognize that relative affordability for the median household is not the issue. The bigger problem is the shortage of low priced inventory for the population segment below the median income level. There is no shortage of high priced inventory.
The reason for the lack of low priced housing inventory was explained in the opening paragraph. Regretfully, the perpetual shortage of low priced housing inventory will remain Oahu’s housing challenge for the future.
Conclusion
Forget the chatter and filter through the noise. Hoping and waiting will not make Hawaii real estate more affordable. Even if you have a crystal ball that can accurately predict an imminent economic recession, relative affordability might not improve to the degree where waiting pays off.
Think about it, when you live in Hawaii you either rent, or you buy . Renting offers the flexibility of moving with short notice. But, if you are committed to living in Hawaii and you are still renting after 3 years or more than you are throwing some serious money out the window.
You can pay off your landlord’s home with little to show for, or you can buy and pay off your own home. But, waiting for lower prices to buy and trying to time the market is a fool’s game.
Instead, consider this: The best time to buy is when you are ready to commit to living in the same neighborhood, and you found a suitable home that you can afford.
We love to hear from you. Let us know your thoughts. Reciprocate Aloha! ‘Like’, ‘Share’ and ‘Comment’ below.
~ Mahalo & Aloha