
— Courtesy of the Honolulu Board of Realtors, on May 9, 2018, local economist Paul Brewbaker with TZ Economics shared his view on the economy, and in particular his outlook for Hawaii’s real estate market.
I first met Paul in 2000 when he boldly predicted that Oahu’s single-family home median sales prices would more than double within 7 years. Unbelievably his prediction came true in 2007. Since then we have been paying close attention to his insightful presentations.
Paul’s presentation comes against the backdrop of the May 4, 2018 release of the latest economic data:
1) US unemployment dropped to an unprecedented 3.9%.
2) current wage growth: 2.6%.
3) current inflation: 1.9%.
These numbers suggest an economy that appears robust moving forward. Following are subjective bullet point notes from Paul’s 5/9/2018 presentation. All graphs courtesy Paul Brewbaker – TZ Economics.
The current US economic expansion celebrated its 9th birthday and is now the 2nd longest expansion in US history. By next year this expansion will become the longest in US history.
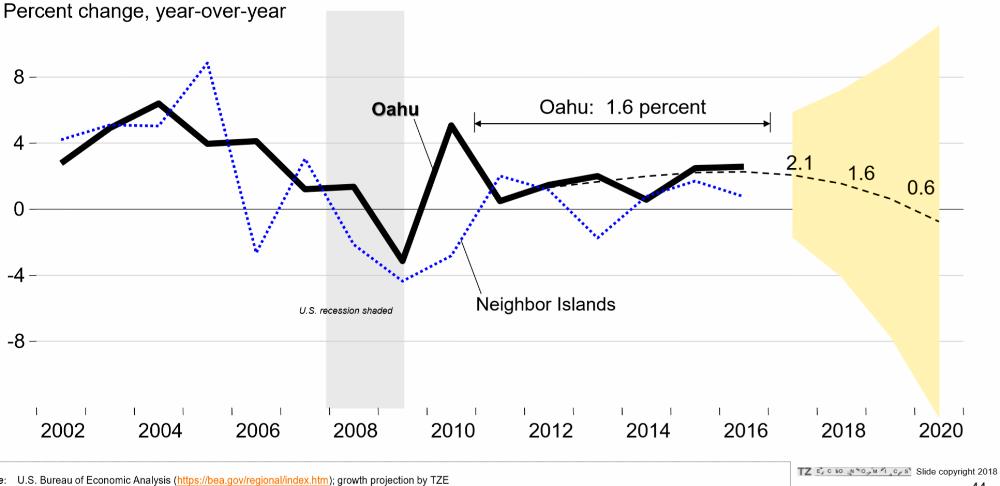
Hawaii’s economy has somewhat underperformed with 1.6% growth compared to the US economy 2.2% growth.
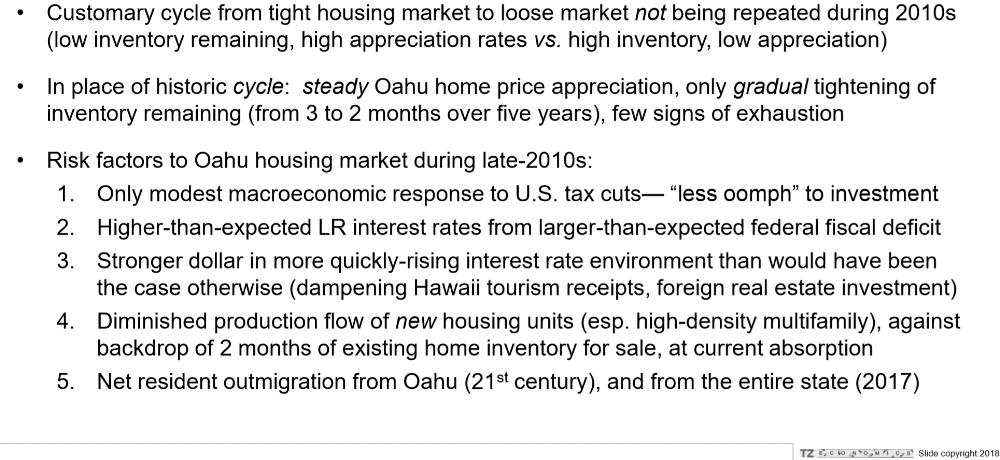
In spite of a solid economy, there are some vulnerabilities for the Hawaii real estate market. Be vigilant. The demand could soften.
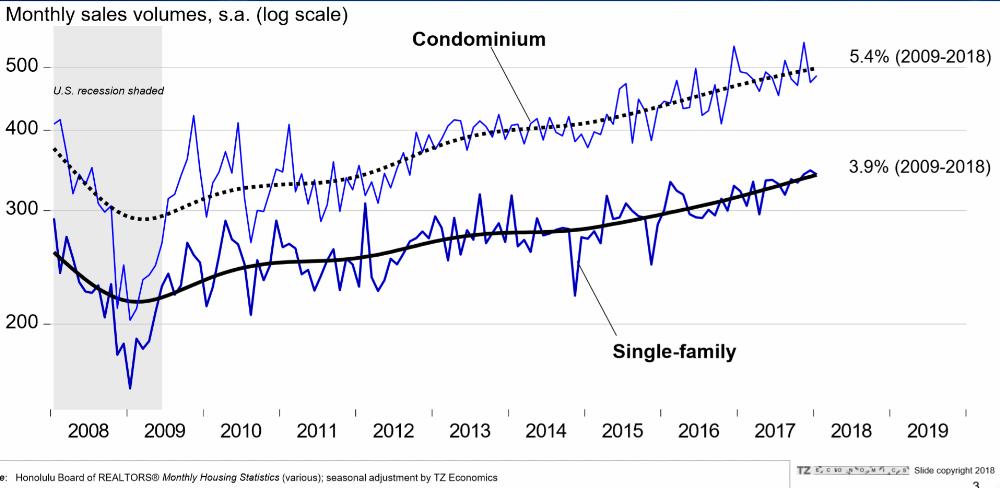
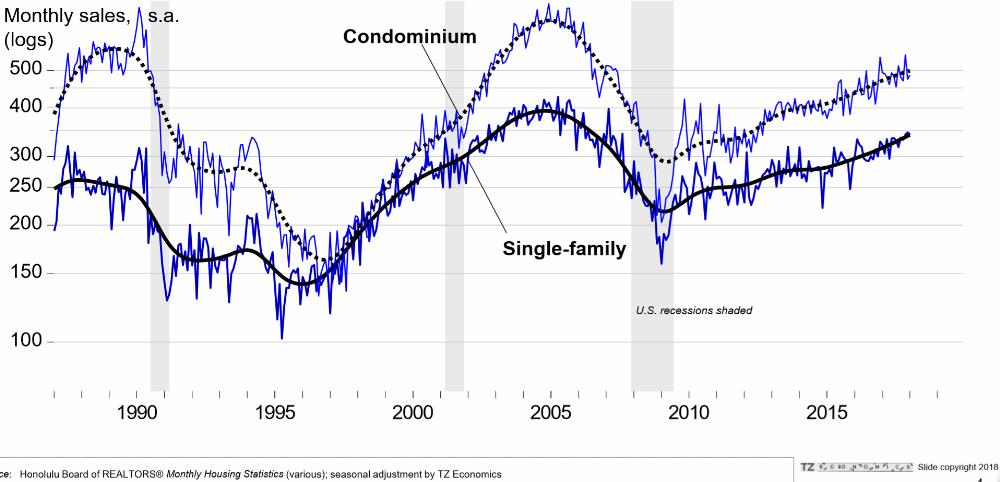
Paul talked about the three lessons learned from the most recent HBR data:
1) Existing home sales volumes have been rising steadily since 2009, but slower than in the past. No bubble here.
2) Steady ‘months of inventory remaining.’ Average 2.8 to 3.0 for the last 5 years, and remarkably low 2.1 to 2.3 for the last 3 years.
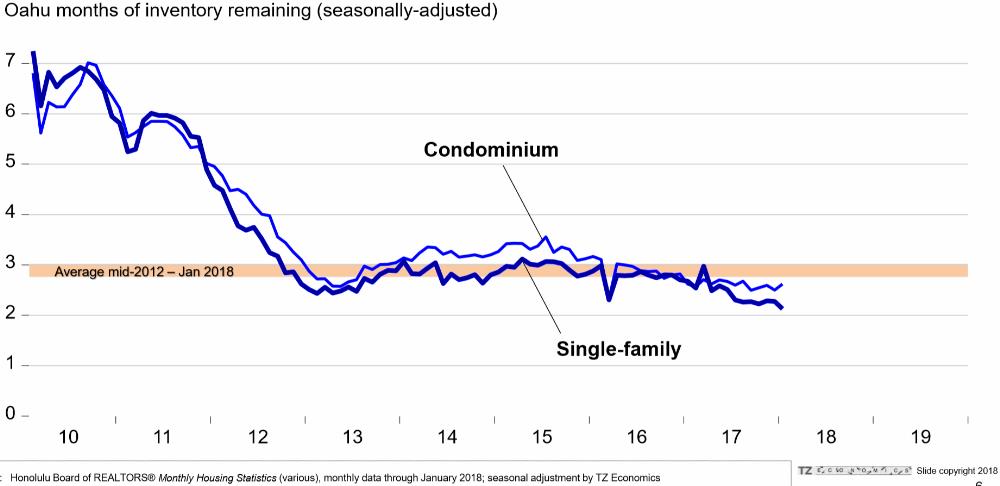
Since 2012, low ‘months of inventory remaining’ is no longer a driver for excessive appreciation. The inverse relationship from before does no longer apply. 2-3 month of remaining inventory does no longer translate into explosive up-moves.
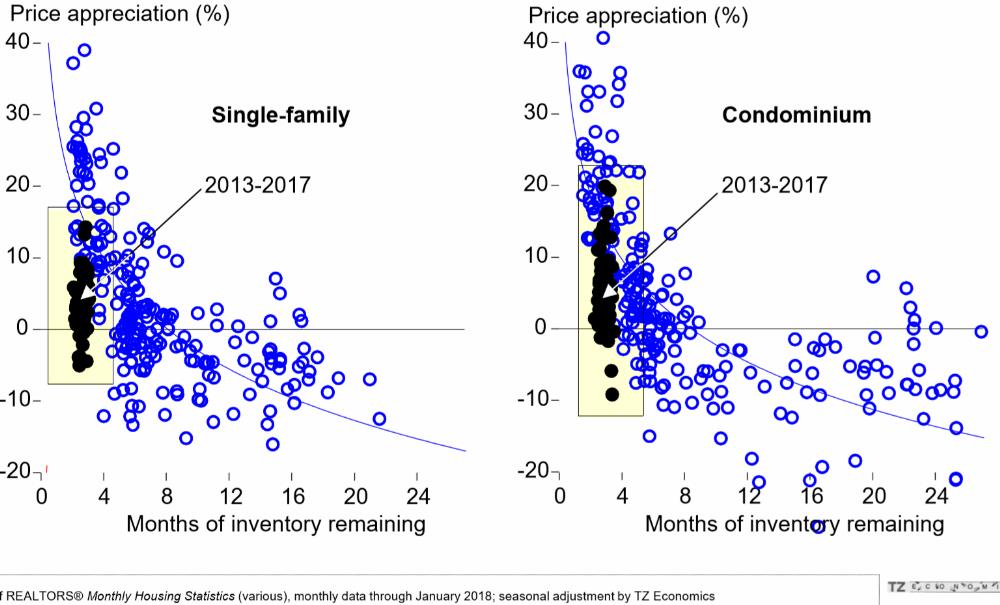
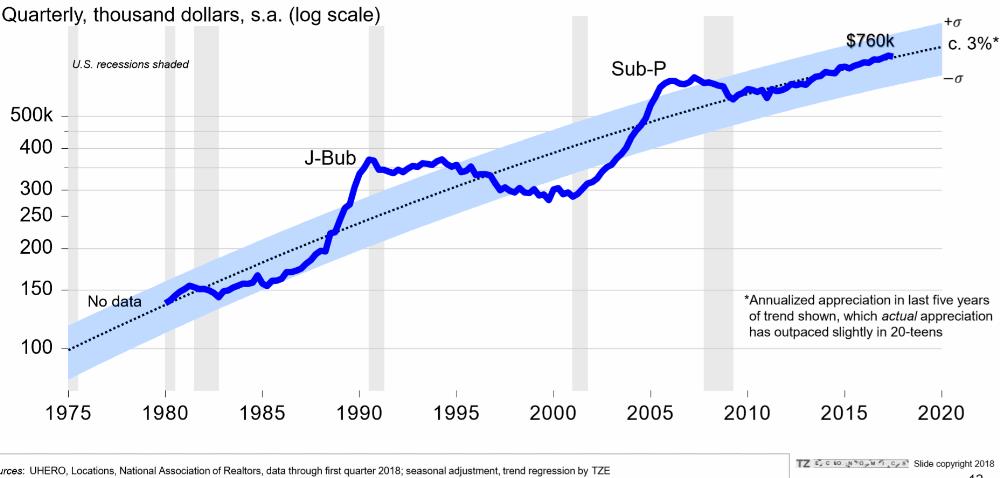
3) Valuations are increasing slowly since 2009. Steady, 5.2% for condos and 4.4% for homes. Not a roller-coaster cycle this time.
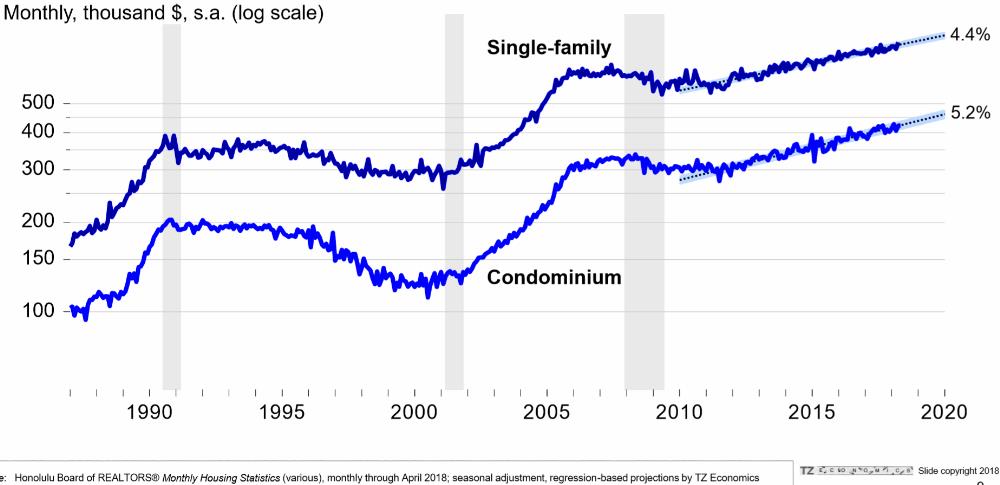
After two rollercoaster valuation bubbles (1990 Japan and 2007 sub-prime), Oahu existing home prices have converged to a steady 4-5% long-term trend. No bubble here. – But could the trend be curving soon? Could the long-term path become 3%?
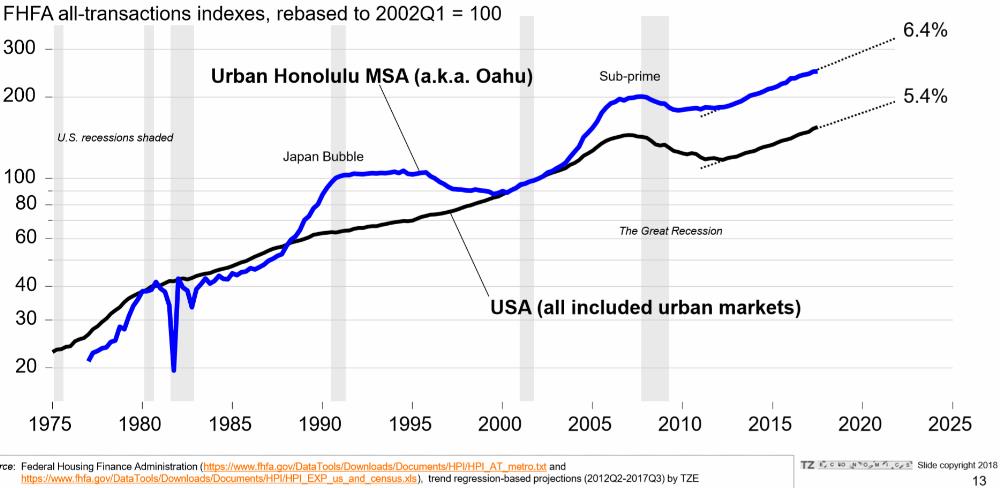
The historical trend between Honolulu home values (more resilient) compared to US urban home values. Since 2009, the current nominal Honolulu home appreciation is 6.4% NOT adjusted for inflation. (After ~2% inflation, real appreciation is about 4.4%). – Honolulu shows two distinct past bubbles. The US only shows the sub-prime bubble which appears to have displaced the US home price trajectory.
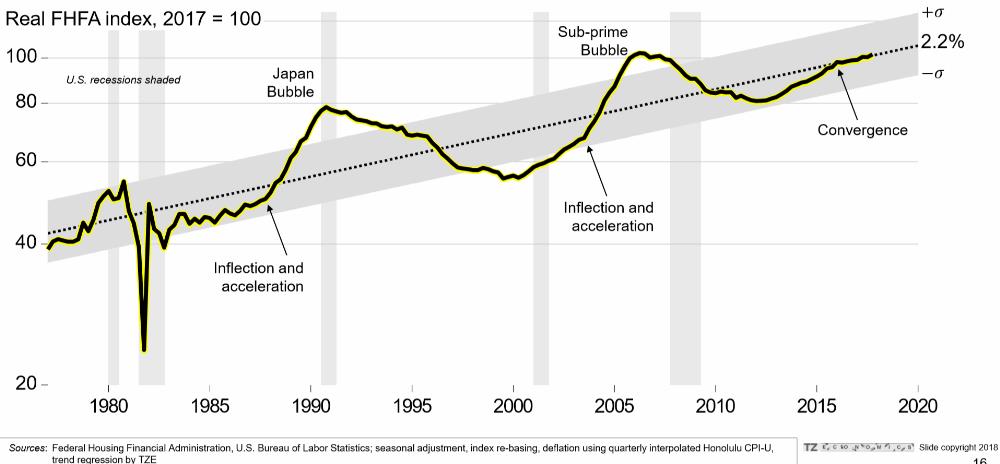
Adjusted for inflation: The real home value appreciation rate is converging to a 2.2% long-term trend.
Summary of Oahu’s existing home market conditions:
Steady growth and appreciation. Absorption is balanced between sales and production. But there is some risk:
Trouble on the horizon?
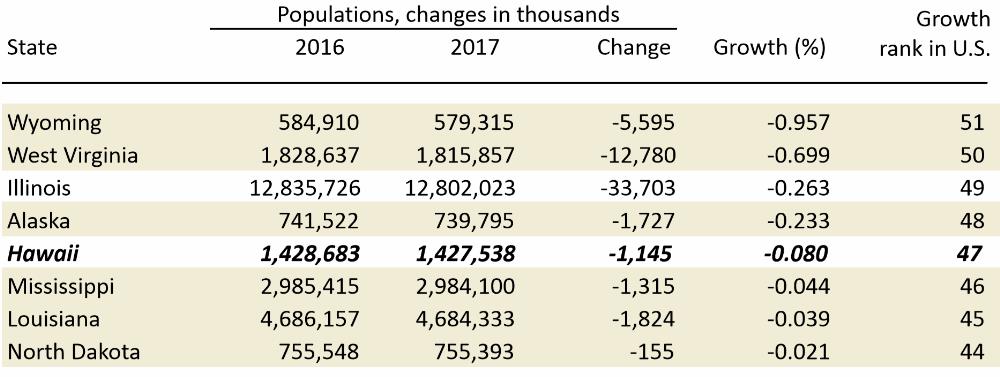
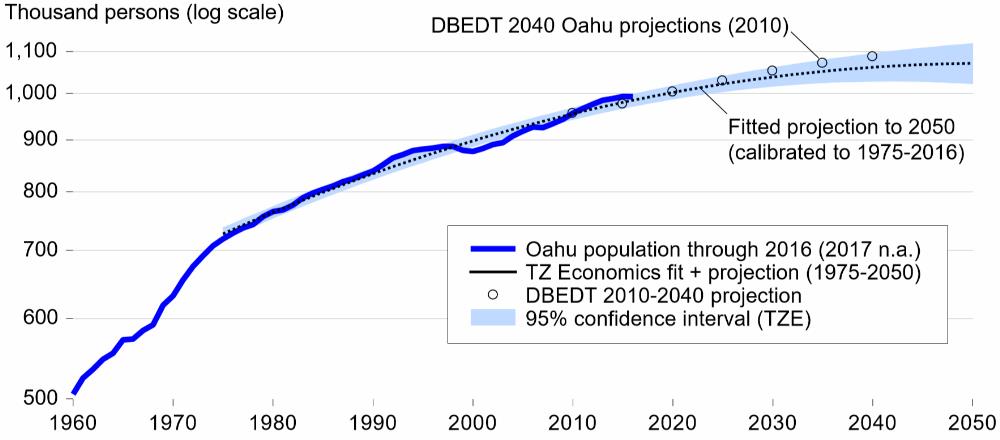
The latest Hawaii state population numbers show that Hawaii was one of 8 US states that ended 2017 with a surprising net out-migration. Hawaii’s population shrunk in 2017 for the first time in many years. Out-migration exceeded all births minus deaths plus immigration.
Time to be vigilant. If this trend continues, the market is expected to slow down and home values and rents could soften.
Affordability has not changed much. Are Boomers moving away?
Oahu real GDP growth is projected to possibly slow to 0.6% by 2020:
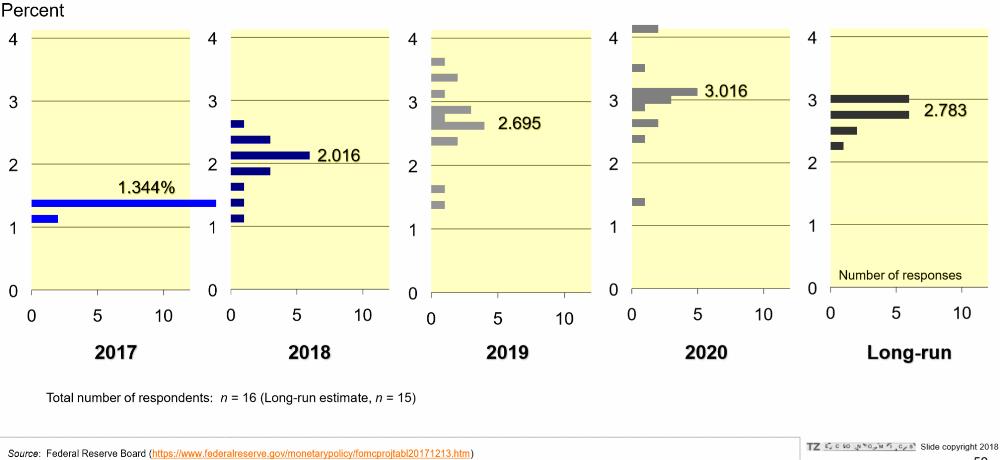
Median federal funds rate forecasts by the Federal Open Market Committee (FOMC) participants during the Dec 2017 meeting. Is the federal funds rate expected to overshoot in 2020?
Hawaii tourism performance: Arrivals set new records, expenditures do not.
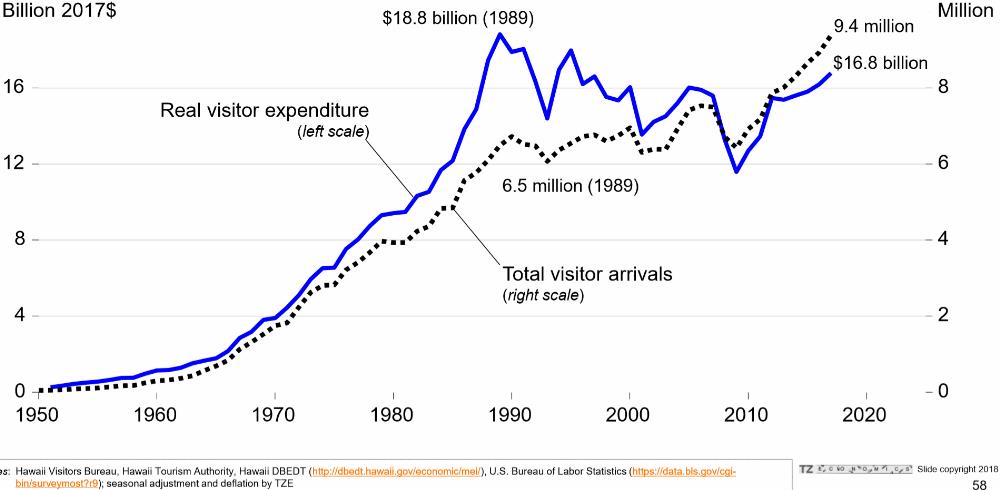
Hawaii tourism expenditures lag and could limit Hawaii’s GDP growth.
Conclusion:
Hawaii could be reaching an inflection point: Both, Hawaii’s economic expansion and the real estate market are vulnerable to slow down.
Compare today’s report with prior year summary reports here: 2017, and 2016.
Let us know what you think. How do you see Hawaii’s real estate market and the general economy?
We love to hear from you. Reciprocate Aloha. ‘Like’, ‘Share’ and ‘Comment’ below.
~Mahalo & Aloha