— Oahu Real Estate Market Update – 2018 Mid-Year
Here we compare the most recent 6 months (January – June 2018) of Oahu real estate sales data with the same 6 months from the prior year. We look for inflection points that could signal a future trend reversal.
Comparing only one month of data with another month would be insufficient because of the narrow sampling size. Using the 6-months rolling average includes sufficient data points to spot any meaningful trend changes.
All historical graphs are courtesy of the Honolulu Board of Realtors, compiled from MLS data.
We notice:
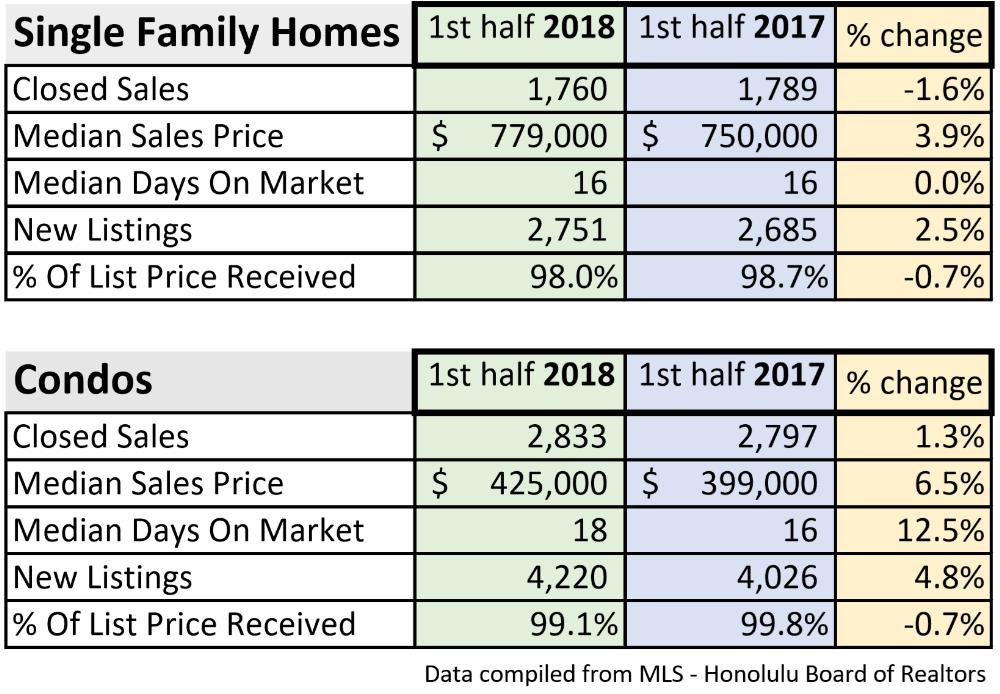
1) The 6-month data shows a slight -1.6% decrease in closed sales for single-family homes versus a continued increase of 1.3% in closed sales for condos.
–– Is it possible that buyers recognize some of the newly built condos as an attractive alternative to the available existing older homes? I personally had several clients that initially were only considering purchasing a single-family home until they realized some of the unique benefits of modern condo living. See related article: Condo or Single-Family Home.
2) The median sales price continued to move up by 3.9% for single-family homes, and 6.5% for condos.
–– This is still a remarkably strong market.
3) Inventory levels have increased by 2.5% for homes and 4.8% for condos.
–– The record low inventory crisis has been somewhat subsiding during the last six months.
4) Median days on market and % of list price received still shows a resilient and strong market.
Here is the long-term trend for Oahu Closed Sales and Median Sales Prices from 1987 through June 2018:
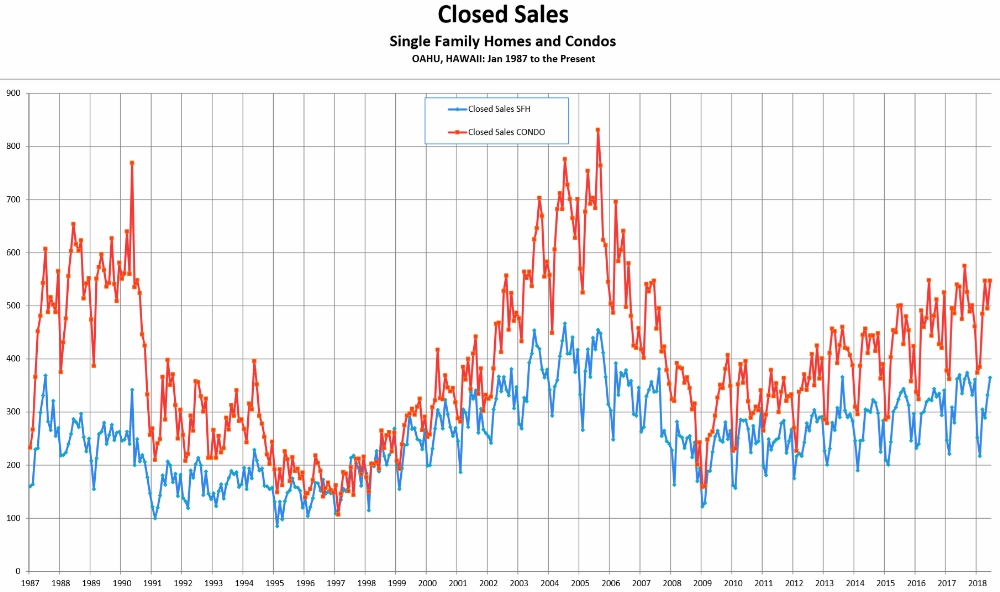
Notice how the seasonal winter low-point of closed sales for single-family homes has not increased in three years. — Could the sideways move in sales activity for single-family homes foreshadow a slowdown in single-family home demand?
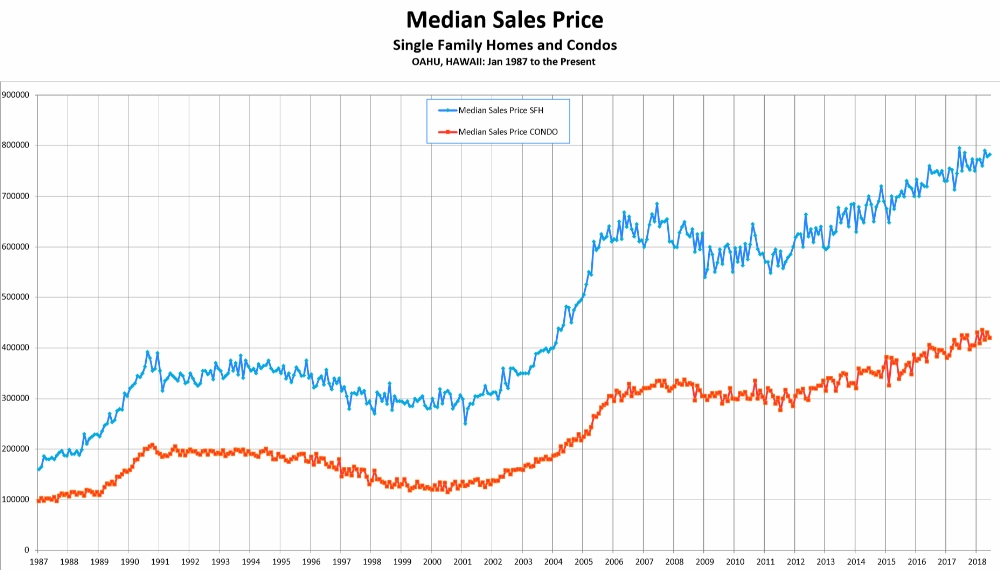
The market continues its uptrend at a steady pace. Oahu’s median sales price has been increasing about 4 – 4.5% per year since 2011. A pace that appears to be sustainable, at least for the time being. See related article: Real Estate Market Outlook – May 2018.
Recent higher interest rates have had no measurable impact on the markets speed and direction. See related article: The Market Is Up!, where we analyze historical data going back to 1987 in search of the alleged inverse relationship between long-term mortgage rates and the median sales price of Oahu real estate. We could not find such evidence.
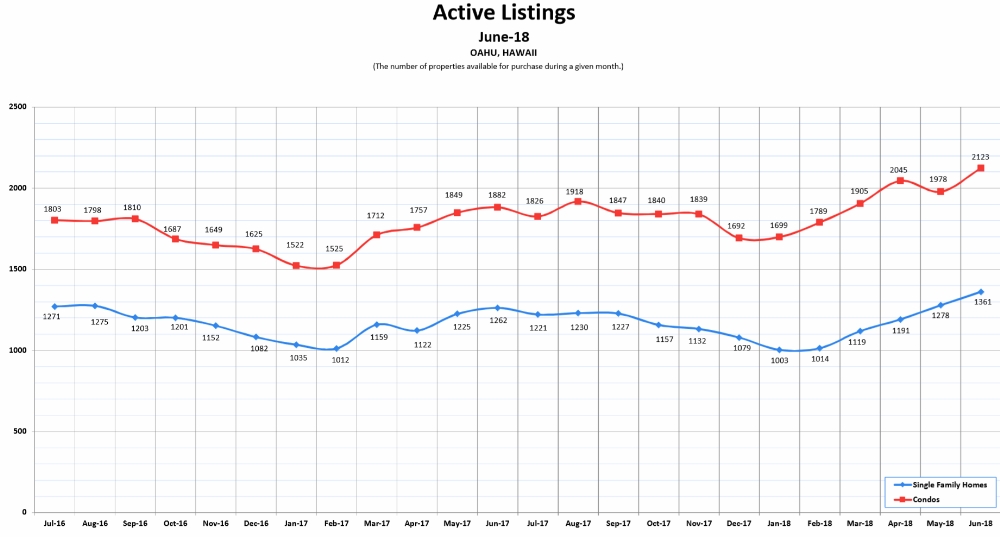
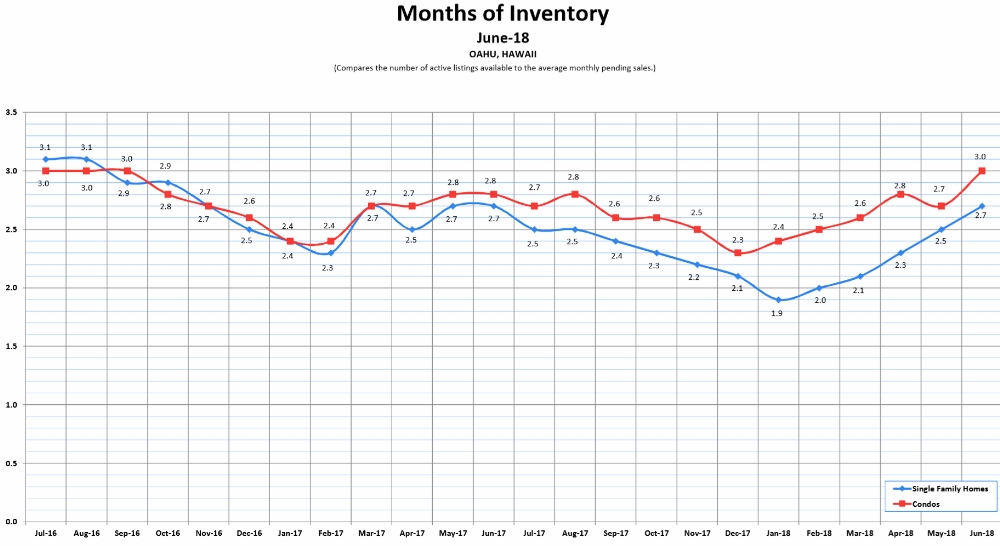
Both graphs above are bouncing off the record lows from 6 months ago. Finally, there is some relief from the recent crisis-low inventory levels. Remaining months of inventory levels currently still hover at a low 3 and 2.7, but off the unprecedented recent record lows off 2 (!).
To keep these numbers in perspective, a stable balanced market typically has about 5-6 months of inventory.
Final two thoughts:
1) There are some that are asking, could we be in another real estate “bubble?”
Perhaps the bubble theory is based on the memory of the last 2005 – 2009 “bubble” and “crash”. Or, it is based on a ‘wishful thinking bias’ by nervous future home buyers hoping for a more affordable entry point.
However, the recent 4-4.5% annual appreciation since 2011 is rather moderate compared to the steep appreciation during 2003-2006. The 2003-2006 “bubble” was an unsustainable over-shooting of the upper price range channel, and the subsequent “crash” was the natural regression to the mean.
Check the graph again, the current uptrend of 4-4.5%/year is consistent with the long-term trend. It IS the mean. Affordability has been steady since 2011, as we discussed here.
According to CoreLogic, US residential real estate values could increase by another 5.1% from May 2018 to May 2019.
As long as there are more renters looking to buy than homeowners willing to sell, prices are poised to move higher.
2) If you want to know where prices are heading, look for changes in the ‘closed sales volume.’ Closed sales dropped in 1990, prices followed in 1991. Closed sales increased in 1997, prices followed in 2001. Closed sales dropped in 2006, prices followed in 2008. Closed sales increased in 2010, prices followed in 2012.
Can you see the pattern? Prices follow the closed sales trend. Do you spot any trend reversal in closed sales?
Conclusion: Oahu’s real estate market continues to move up and is expected to move higher.
Let us know what you think. We love to hear from you! Reciprocate Aloha! Like, Share and Comment below. ~ Mahalo & Aloha