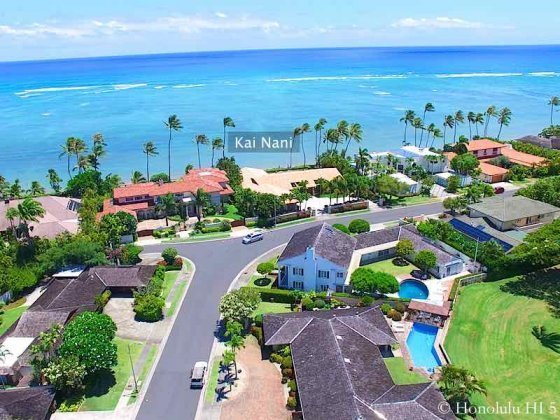
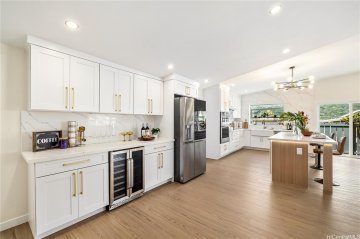
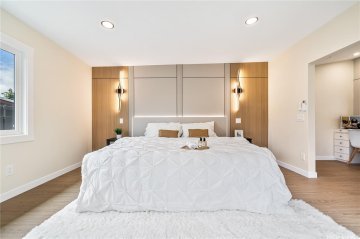
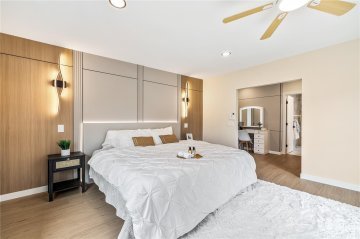
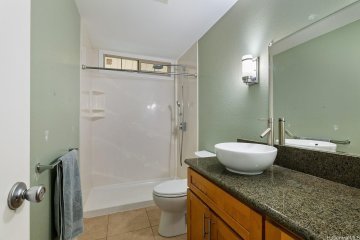
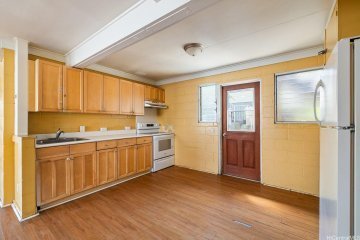
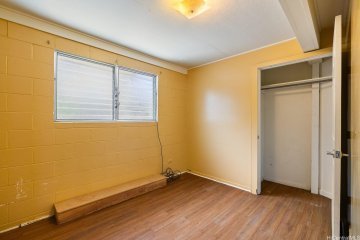
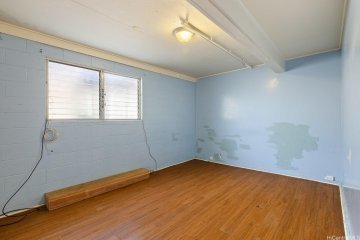
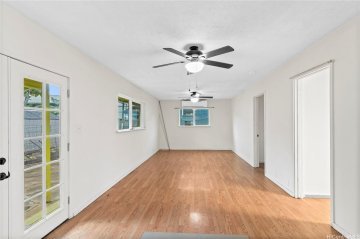
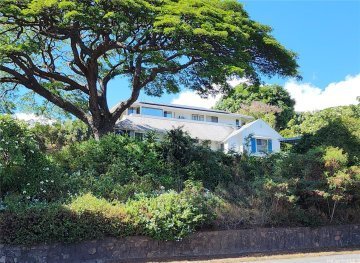
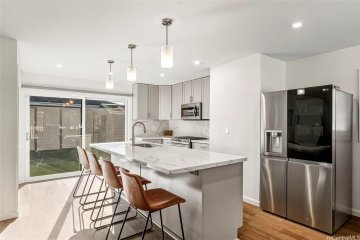
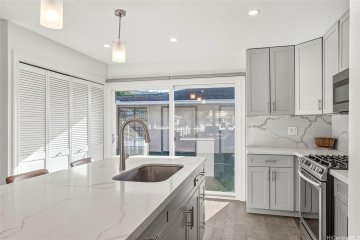
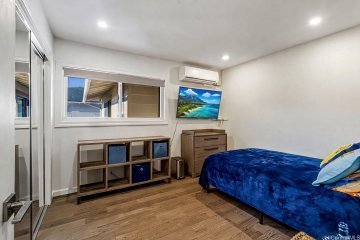
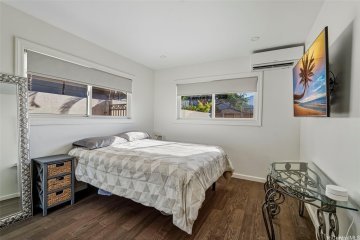
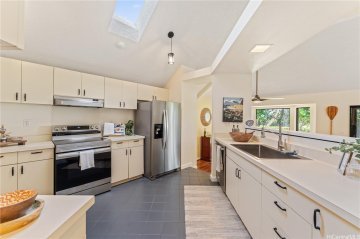
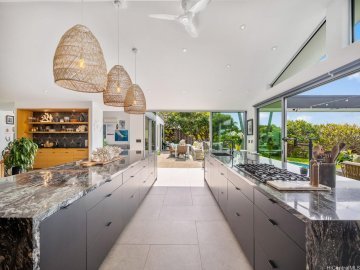
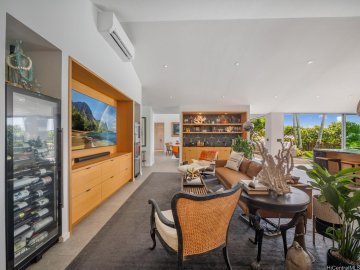
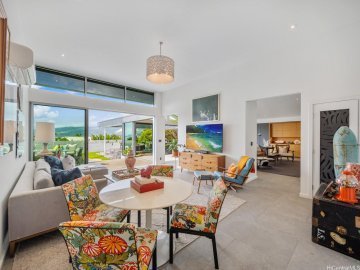
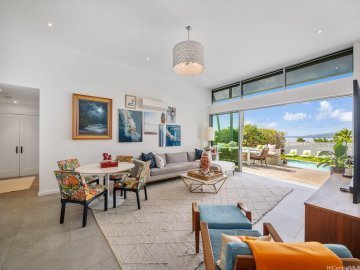
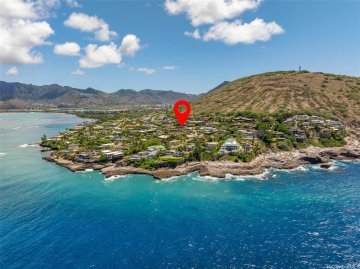
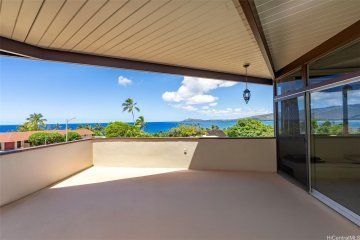
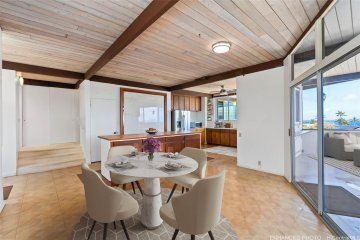
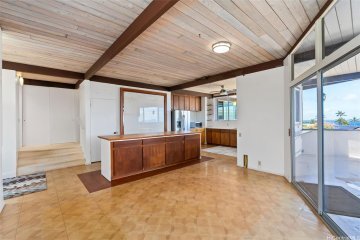
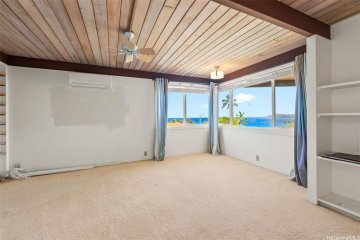
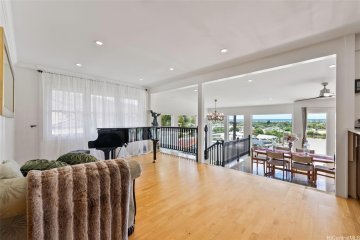
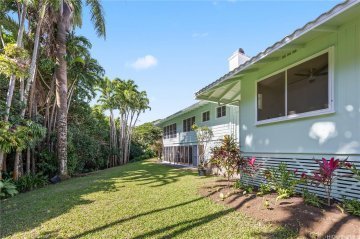
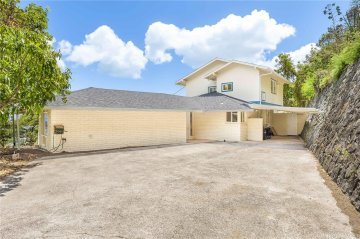
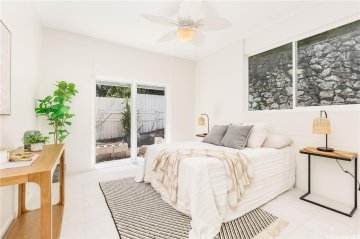
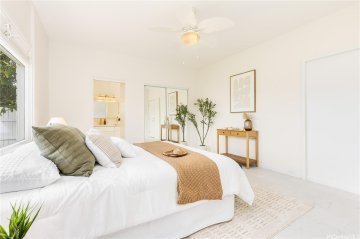
Neighborhoods Honolulu features a wide array of neighborhoods, each with its own unique character. This section highlights six of them, illustrating the diverse single-family home lifestyles available across the city.
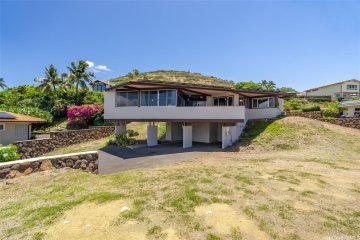
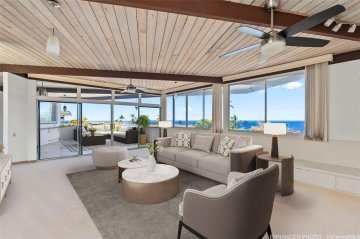
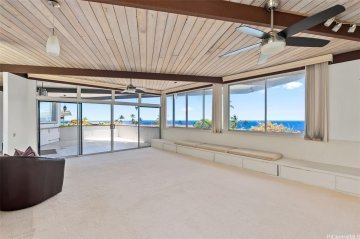
Hawaii Loa Ridge Gated hillside with large luxury homes, mostly from the 1980s, some newer builds on once-vacant lots, resembling upscale California enclaves.
Kahala Flat terrain, home to prestigious Kahala Ave’s $20M oceanfront estates and a mix of modern and vintage homes tied to prominent Hawaiian families.
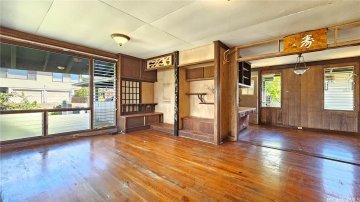
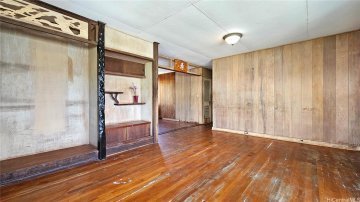
Manoa Old Hawaii charm with well-preserved historic homes, lush greenery, and a peaceful, rainy ambiance.
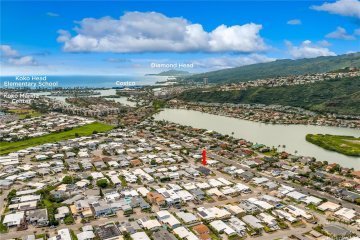
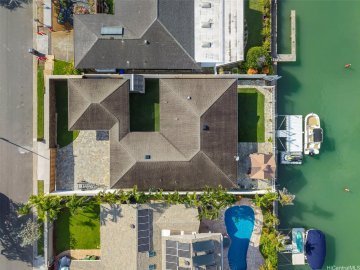
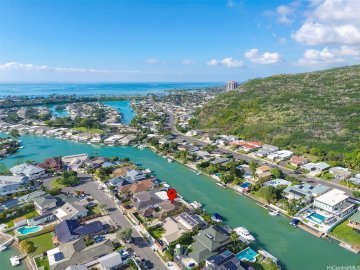
West Marina Marina-front homes with private boat docks, enabling boat trips to the ocean or nearby shopping.
Tantalus Rainforest living near Downtown, cooler climate, large lots.
Waialae Golf Course Golf-centric living along Oahu’s top course, hosting the PGA Tour annually.
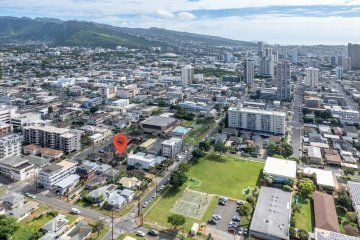
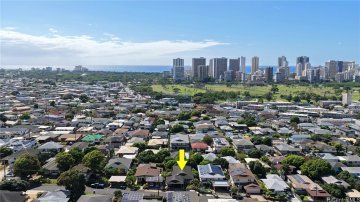
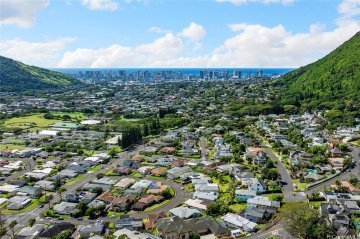
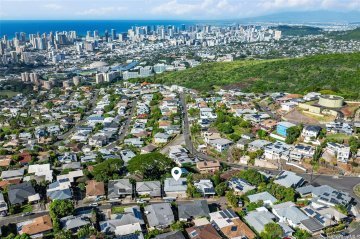
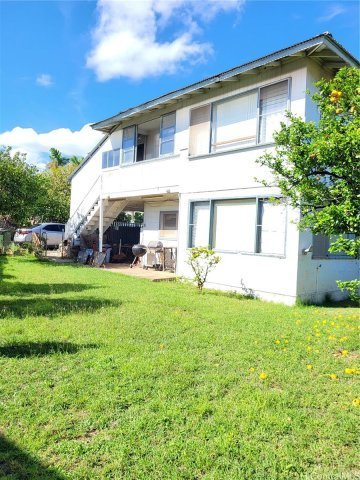
About Honolulu A mix of tropical beauty, modern urbanity, and small-town vibes, featuring palm-lined beaches, high-rise condos, malls, and vintage homes. Year-round outdoor living is key, with most of Oahu within an hour’s drive - North Shore’s waves, Kailua’s calm, or Ko Olina’s resort scene - except during rush hour.
History Honolulu grew from its harbor, spotted in 1793 by Captain William Brown for its depth, sparking trade and whaling hubs. By the late 1800s, sugar and pineapple plantations dominated, drawing Asian and European workers who later settled here. Tourism emerged in the 1920s, evolving from harbor cruises to a hotel-driven industry, cementing Honolulu’s real estate landscape.
Over the past 3 years, an average of 833 fee simple homes sold per year in Honolulu. This large sample size makes the graph a highly reliable indicator of market trends.
The Honolulu graphs use median data points instead of averages, as the median is less affected by extreme outliers and better reflects typical trends.
Honolulu Homes Market Summary (February '25 - January '26 vs February '24 - January '25)
Median Sales Price: $1,431,250 vs $1,450,000 — down 1.29%
Number of Sales: 938 vs 830 — up 13.01%
List-to-Sale Price Ratio: 98.71% vs 100% — down 1.29%
Listings appear instantly - new properties added within one minute.
We need your email address, if you would like email alerts. Please Create Account - takes 1 min - or Sign In .
We exclude Leasehold data from this market analysis because Leasehold properties do not compare with regular Fee Simple properties.
We use median instead of the average because it depicts more accurately a central tendency to the sample size. Example: Take 5 numbers - 3, 5, 7, 9, 21. The median is 7 (the middle number) and the average is 9 (sum of all divided by 5).
We count days on market from listing date through closing date.